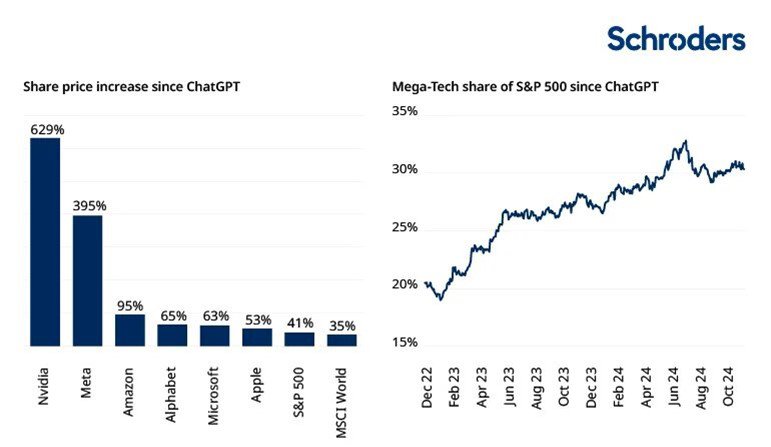
 Source: Schroders, Bloomberg, as at close 18 November 2024. Note: ChatGPT launched November 2022. Any reference to regions/countries/sectors/stocks/securities is for illustrative purposes only and not a recommendation to buy or sell any financial instruments or adopt a specific investment strategy.The outlook for these companies, and for the technology sector in general, remains generally positive. The largest companies are not homogenous but do share one common denominator. They tend to have specific characteristics that allow them to dominate their respective industries and generate exceptional growth, margins and returns.Unless there is significant regulatory intervention to break these “franchises”, they will likely remain extraordinarily profitable companies and important components of global portfolios.However, one growing issue for this group is the sheer volume of spending being directed toward AI. As the chart below shows, the three big providers of AI infrastructure, Microsoft, Alphabet-owned Google and Amazon – known as the “hyperscalers” – are investing gigantic sums in an AI “arms race”, and the rate of spend shows no sign of abating.In part, this is because they can afford to invest huge sums, given rock solid balance sheets and strong cashflows. However, the right-hand chart below shows that the forecast incremental sales from these investments – over the next two years at least – are actually quite modest. The market is just not sure that the monetisation of these investments will be positive for shareholders.Key question: can future revenue justify current AI capital expenditure?US$125 billion AI spend vs maybe US$10-20 billion incremental revenue…
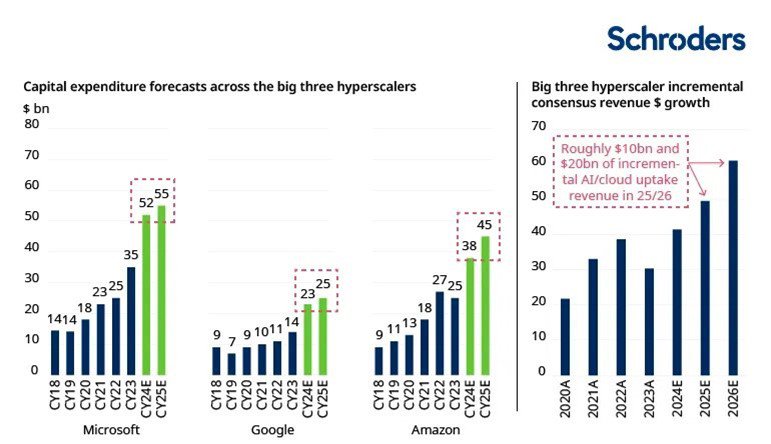 Source: LHS – Goldman Sachs, company data as of 15 July 2024. Hyperscalers include Amazon, Microsoft, Google. Amazon capital expenditure is GSe specific to only AWS, Google capital expenditure is GSe of server and network equipment and Microsoft capital expenditure is on a consolidated basis. Source: RHS – Barclays Research, Bloomberg consensus, company documents as of 25 June 2024. Any reference to regions/countries/sectors/stocks/securities is for illustrative purposes only and not a recommendation to buy or sell any financial instruments or adopt a specific investment strategy.The above comes at a time when, for the largest technology companies at least, earnings growth is beginning to slow. If the pay-back period from AI proves to be very long, investors are right to be questioning the sustainability of technology dominance, at least for the most exposed companies such as Nvidia.Equities are expensive, but elevated valuations can be sustained (for the time being)One consequence of the ongoing bull market in equities is that they have become expensive. Using a range of different and commonly-used valuation measures, and comparing them to their long-term (15-year) medians, the US appears extremely highly valued, and no other market can be described as cheap. Even unloved markets such as the UK and Japan are by no means bargain-basement.Against that backdrop, equity markets are quite vulnerable to some form of negative catalyst (for example, an external shock arising from conflict escalation).In reality, however, these valuations are likely to prove quite well supported in the short-term. From a macro-economic standpoint, global inflation remains on a downward trajectory, allowing central banks to embark on a relatively synchronised interest-rate cutting cycle.Historically, as the chart below shows, falling rates have nearly always supported equity markets. Given the current strength of the US economy, a recession looks unlikely and business confidence in some of the more rate-sensitive parts of the global economy will likely strengthen.Stocks have beaten bonds and cash when rates fall
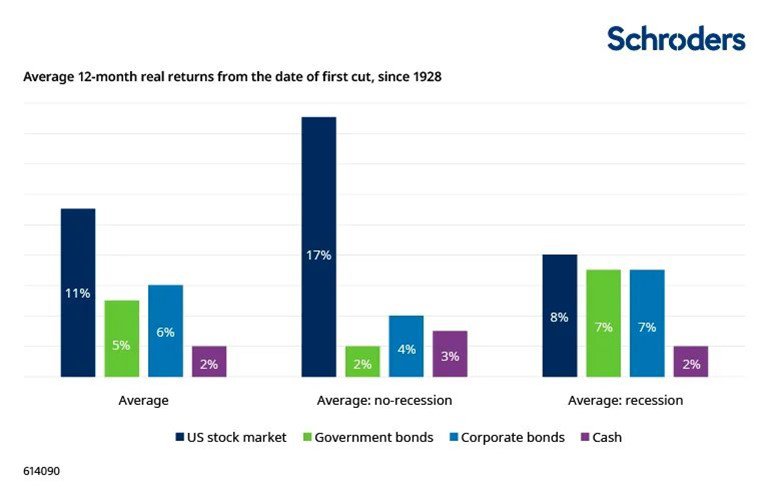 Source for return data: CFA Institute Stocks, Bonds, Bills, and Inflation (SBBI®) database, and Schroders. Source for Fed Funds data: Post-1954 is direct from FRED. Earlier data is based on the Federal Funds rate published in the New York Tribune and Wall Street Journal, also sourced from FRED. An approach consistent with that outlined in A New Daily Federal Funds Rate Series and History of the Federal Funds Market, 1928-54, St Louis Fed, has been followed. For that earlier data, a 7-day average has been taken to remove daily volatility i.e. the month-end figure is the average in the 7 days leading up to month-end. Data to end 2023.From a bottom-up standpoint, the ongoing strength of the US economy and gradual stabilisation in the rest of the developed and developing world should provide scope for sales and profit growth in 2025.Consensus earnings estimates over the next two years for the key global regions are strong: 8-12% average growth each year (source: LSEG Datastream, Schroders Strategic Research Unit, as at November 2024). Assuming no de-rating of equity markets, the return opportunities from global equities would be reasonable, if not spectacular.Implicit in these numbers and linked to the earlier discussion around the Mega-Tech stocks is the idea of a “broadening-out” in markets: that is to say, hitherto neglected areas such as smaller-capitalisation/sized companies, begin to benefit from positive fund flows. As the table below shows, small- and mid-sized companies are cheap versus both large caps and against their own history.Equities aren’t cheap, especially in the USBut smaller companies are relatively attractive now.
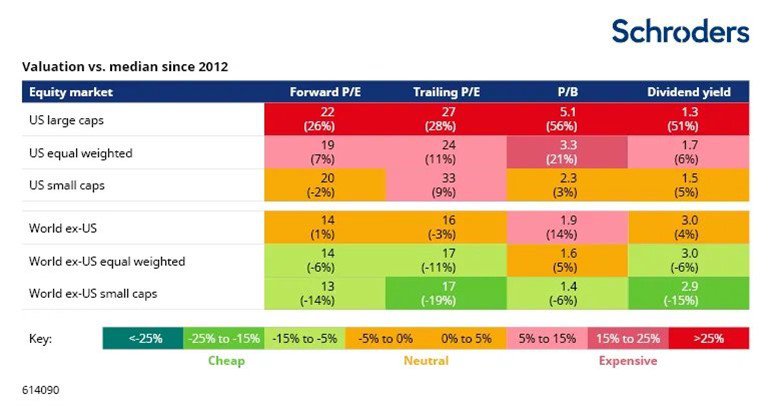 Source: LSEG Datastream, MSCI and Schroders Strategic Research Unit. Data to 30 September 2024. Note: Figures are shown on a rounded basis. Assessment of cheap/expensive is relative to median since April 2012. This is the longest time period for which data is available on all six markets, which are respectively represented by the following indices: MSCI USA, MSCI USA Equal-weighted, MSCI USA Small Cap, MSCI World ex US, MSCI World ex US Equal-weighted, MSCI World ex US Small Cap.
Trump 2.0: a lot can happen
If the message so far has been quite optimistic, the recent election of Donald Trump for a second term as US president is likely to prove the wild card for investors in the medium-term. There isn’t scope in this article to get into the weeds on potential outcomes but these are our high-level views:- “America First”: this policy is going to apply to a raft of different areas but in a nutshell means less globalisation, weaker alliances, and more uncertainty. Markets, for obvious reasons, don’t like uncertainty.
- Tariffs and personal taxes: if Trump proceeds with his planned and much vaunted policy of imposing 10% or 20% tariffs on all imports and 60% tariffs on imports from China, the effects will be dramatic. As the chart below shows, a tariff is a direct and regressive tax on the US consumer. Trump may try to offset the impact through personal tax cuts (largely to the benefit of the top 1% of earners) but in any event the impact will be inflationary. The bond market is already taking note.
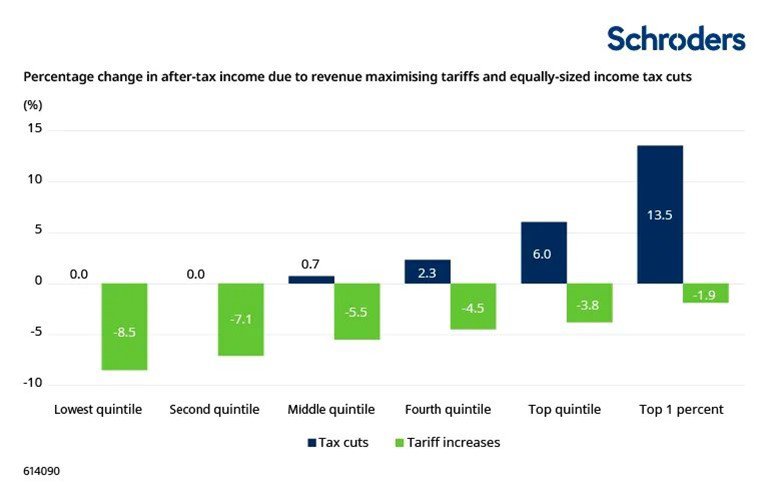 Source: Peterson Institute 2024. Calculations based on consumer expenditure survey data from the US Bureau of Labour Statistics and tax and income distribution data from the US Treasury. Note: Assumes maximum tariff effect: 20% on all imports, 60% on China imports.
- Corporate tax cuts: it may well be that Trump keeps the US profit plate spinning by cutting corporation tax from the current 21% to 15%. This would undoubtedly have a positive effect on the stock market.
- Immigration policy: if he goes ahead with his plan to deport up to 10 million undocumented immigrants (80% of whom have lived in the country for more than 10 years), the effect on GDP could be significant, especially in the border states. It would also be highly costly to effect.
- Energy policy: three words sum up the Trump team’s view on energy: “Drill Baby Drill”. It’s all about bringing down the cost of gasoline for consumers, so Trump will encourage the US oil sector to bring forward production plans and boost growth. Not good for the decarbonisation of the global economy and the climate, and at face value not good for the quoted renewable sector either. The saving grace may well be that the rest of the world seems to be moving ahead with plans for carbon reduction and net zero alignment, a process in which US green energy companies will probably participate. Although perhaps not as much as they might like.
Emerging-market equities
The outlook for emerging market (EM) equities is coloured by uncertainty relating to the impact of a Trump administration. Valuations excluding India and Taiwan are broadly cheap, but markets are facing a period of uncertainty. Key drivers include tariff risk, a strong US dollar and higher US yield curve (higher US bond yields), Chinese policy action, India and technology trends.Trump’s win creates a period of uncertainty for emerging markets
Trump’s policies are expected to put upwards pressure on US inflation, lifting the US yield curve and supporting the US dollar. This tightens financial conditions in EM and acts as a headwind to market performance.However, we have already seen a significant move in the US dollar, pressuring EM currencies, many of which screen as cheap. Meanwhile, US bond yields and Fed rate expectations have also adjusted markedly, and EM real interest rates (adjusted for inflation) are elevated.US yield curve has moved higher in response to Trump’s policies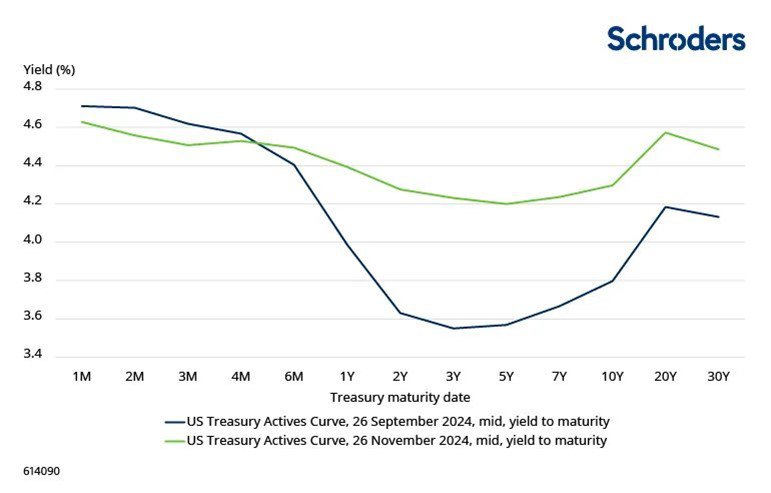 Source: Bloomberg, Schroders. 26 November 2024.Trump also brings tariff risk, both in relation to broad based tariff application (on all imports into the US) and a significant increase in tariffs specific to China (an increase to 60% was mooted in campaign rhetoric). If tariffs are implemented rapidly and in line with campaign rhetoric, part of the impact would be absorbed via EM currency depreciation, but there would likely be a substantial impact on US inflation, which would disproportionately affect lower income households, a key element of Trump’s support base. Consequently, we would expect a more nuanced approach to tariff application than suggested by campaign rhetoric.In relation to China specifically, Trump’s cabinet appointments look to be broadly politically hawkish towards the country so we would expect asymmetric tariffs to be applied. Depending on scale, this could impact China’s trade volumes and may lead to renminbi (RMB) devaluation, though it may also drive an acceleration in Chinese stimulus to defend growth.Renminbi devaluation may pressure competing EM currencies, although on a medium-term basis, competing EM manufacturing economies will likely benefit from ongoing supply chain diversification.Finally, in relation to Trump’s impact on geopolitics, there are both risks and opportunities. As noted, Trump’s team look hawkish on China and a process of decoupling is expected to continue which may not always be smooth. In Ukraine, if a peace deal is accompanied by sufficiently strong security guarantees, this and significant reconstruction spend could benefit emerging European economies and risk premia.
China’s economy and market will remain sensitive to policy announcements
In China, there was a visible move towards more co-ordinated and determined policy support in September 2024. However, monetary policy settings remain tight and the follow-through on fiscal policy has disappointed. The trade cycle is expected to soften through 2025 and China now faces tariff risk from a Trump administration. However, there are some signs of stabilisation in real estate markets in the largest “tier-1” cities.We believe there is now a stronger policy backstop to China’s economy and market. Policy announcements can drive the market, and positioning remains relatively supportive.There may be an opportunity to add to India in coming monthsIn India, the market is richly valued versus history, profit margins and earnings expectations are elevated, and escalating equity supply has increasingly offset strong domestic fund flows. Most recently, nominal growth (i.e. growth unadjusted for inflation) has slowed, led by tighter fiscal and monetary conditions, and the market has softened as earnings expectations are challenged. This may present an opportunity.The monsoon was good in 2024, which typically leads to an improvement in rural incomes, while there is some scope for monetary easing. India is also geopolitically neutral and less exposed on tariffs versus other EM and has an interesting structural growth opportunity.Finally, foreign investors have low allocations to India. We will be monitoring the market in the coming months, looking for a sufficient re-set in valuations and earnings expectations to lift our exposure.Will the technology cycle continue into 2025?We have been moving through the technology cycle, led by AI. The valuations of technology companies are higher and there is uncertainty regarding the sustainability of AI-related capital expenditure, given the lag on monetisation.We see momentum sustaining in the near term given the potential in the technology and the reluctance of any “hyperscaler” – the big US providers of AI infrastructure – to lag its peers.Other areas of the technology sector remain soft and in an extended downcycle. Here, we may see an improvement off a low base through 2025, in certain cases supported by improving product cycles.Valuations are broadly supportive, but uncertainty reigns in the near termIn the near term, there are three key areas of uncertainty: the impact of a Trump administration, AI momentum, and Chinese policy support. However, valuations in many markets are broadly cheap, as are EM currencies. Much is priced in and a stressed or uncertain environment may provide opportunities to add to exposures in the coming months.Glossary:Valuation measures - There are many different measures of equity valuations, the table in the text above uses these:Forward P/E multiple - The forward price-to-earnings multiple or forward P/E involves dividing a stockmarket’s value or price by the aggregate earnings of all the companies over the next 12 months. A lower number may represent better value.Trailing P/E multiple - Similar to forward P/E but takes the past 12 months’ earnings instead so involves no forecasting. However, the past 12 months may also give a misleading picture.Price-to-book (P/B) ratio - A company’s ‘book value’ is the value of its assets minus its liabilities (net asset value), at a set point in time. Aggregated to the market level, it can be used to assess a stock market’s value, or price, relative to its net asset value.Dividend yield - The dividend yield is a stock market’s value or price divided into aggregate dividends. Because dividends are cash actually being paid out to investors as opposed to earnings, which are an accounting concept, it may be a more reliable valuation metric.Risk premia - Risk premia are the excess returns above the risk-free rate factored into valuations to compensate investors for the higher uncertainty associated with riskier assets. The risk-free rate depends on domicile - for US-based investors it is often the interest rate on the three-month Treasury bond.Want to search and invest in related funds?Open the WeLab Bank App and click【Featured Funds】to find out more!Importance NoticeThis document is for general information only. The information or opinion herein is not to be construed as professional investment advice or any offer, solicitation, recommendation, comment or any guarantee to the purchase or sale of any investment products or services. This document is for general evaluation only. It does not take into account the specific investment objectives, financial situation or particular needs of any particular person or class of persons and it has not been prepared for any particular person or class of persons. The investment products or services mentioned in this webpage are not equivalent to, nor should it be treated as a substitute for, time deposit, and are not protected by the Deposit Protection Scheme in Hong Kong.The information or opinion presented has been developed internally and/or taken from sources (including but not limited to information providers and fund houses) believed to be reliable by WeLab Bank, but WeLab Bank makes no warranties or representation as to the accuracy, correctness, reliabilities or otherwise with respect to such information or opinion, and assume no responsibility for any omissions or errors in the content of this document. WeLab Bank does not take responsibility for nor does WeLab Bank endorse such information or opinion.Investment involves risks. The price of an investment fund unit may go up as well as down and the investment funds may become valueless. Past performance is not indicative of future results. WeLab Bank makes no representation or warranty regarding future performance. Any forecast contained herein as to likely future movements in interest rates, foreign exchange rates or market prices or likely future events or occurrences constitutes an opinion only and is not indicative of actual future movements in interest rates, foreign exchange rates or market prices or actual future events or occurrences (as the case may be).You should not make any investment decision purely based on this document. Before making any investment decisions, you should consider your own financial situation, investment objectives and experiences, risk acceptance and ability to understand the nature and risks of the relevant product(s). WeLab Bank accepts no liability for any direct, special, indirect, consequential, incidental damages or other loss or damages of any kind arising from any use of or reliance on the information or opinion herein. You should seek advice from independent financial adviser if needed.WeLab Bank is an authorised institution under Part IV of the Banking Ordinance and a registered institution under the Securities and Futures Ordinance (CE Number: BOJ558) to conduct Type 1 (dealing in securities) and Type 4 (advising on securities) regulated activities.This document is issued by WeLab Bank. The contents of this document have not been reviewed by the Securities and Futures Commission in Hong Kong.

